FCC and Graphene Bands
From a tight-binding problem set, computed with PythTB.
Tight binding is the cheapest model that still gives an honest band structure. Put one orbital on each lattice site, let electrons hop only to nearest neighbors with amplitude , and the Hamiltonian in k-space is already diagonal in the band index. For a Bravais lattice with one site per cell the single band is written as
where the sum runs over the nearest-neighbor vectors and is the onsite energy. Everything that follows comes from evaluating this sum on different lattices.
The FCC band
The face-centered cubic lattice has primitive vectors , , and twelve nearest neighbors. With and , sweeping along the standard path through the high-symmetry points gives the single band below.
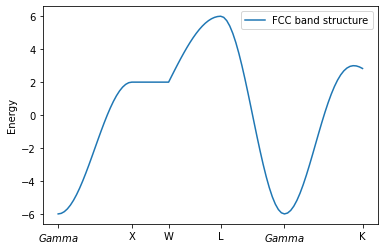
The bandwidth is set by the coordination. More neighbors means more terms in the sum, and close-packed FCC thus produces a wide band. The shape between the labeled points is a fingerprint of the lattice geometry that shows up in real FCC metals well before any serious theory is applied.
Graphene and its density of states
Graphene needs the two-site honeycomb cell, and its two bands touch at the K points of the Brillouin zone. Histogramming the eigenvalues over a uniform k-mesh gives the density of states.
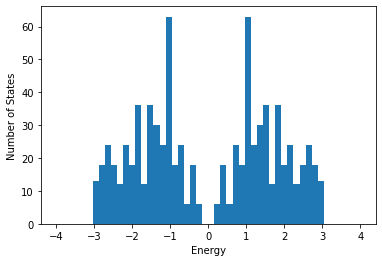
Notice two features. The density of states drops to zero at zero energy without a gap, which is the signature of the Dirac points, where the bands touch only at isolated k-points. And the two sharp peaks at are van Hove singularities, coming from saddle points of the dispersion at the M points. Adding a next-nearest-neighbor hopping (a tenth of in the problem set) breaks the symmetry between the two bands, tilting the spectrum such that the electron and hole sides are no longer mirror images.
Zigzag nanotubes
Rolling graphene into a cylinder quantizes the momentum around the circumference, and a nanotube’s bands are thus one-dimensional slices of the graphene dispersion. For a zigzag tube the allowed transverse momenta hit the Dirac point only when is divisible by 3, and those tubes are therefore metallic while the rest are semiconductors. Plotting the lowest subband for , none of which is divisible by 3, the dispersion stays pinched off from zero energy with a small gap, and zooming in near the minimum confirms the gap never closes. Two thirds of all zigzag tubes are semiconductors by this counting argument alone.
Feel free to contact me if there is an error or confusion!